Click here for the latest S&P 500 trend investing and long-term market timing signals.
The return of the S&P 500 over 2010 was good: 13%. However, the annualized returns of the S&P 500 for the last 3, 5 or even 10 years are very poor. Just buying and holding an S&P 500 index fund does not make financial sense. However, with trend investing and long-term market timing, investing in the S&P 500 does start making sense.
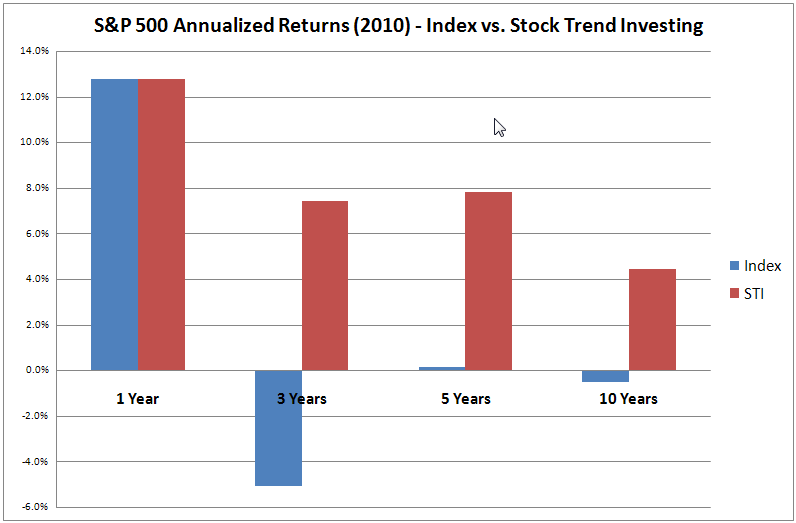
The chart above shows the annualized returns for periods of 1, 3, 5 and 10 years for the S&P 500 Index and for an STI Trend Signal. STI stands for Stock Trend Investing.
- For a 5 year period, the S&P 500 Index is just barely positive (0.1%). But from a 3 or 10 year perspective, the S&P 500 Index provides a negative return.
- Having your money invested in the S&P 500 Index for 3 years, gave you an annualized loss of 5% for those 3 years. In absolute terms you lost more than 14% of your money.
- For a 10 year period, your annualized loss is still 0.5% and in total almost 5%. Thus after 10 years you only get 95% of your money back.
- When you use a solid Trend Investing and long-term market timing signal, the returns are completely different. For a 5 year period, your annualized returns are almost 8%.
Even for a 10 year period, one that stated just before the meltdown of the dot.com bubble, your annualized return is still more than 4%.
Learn More about Trend Investing and long-term Market Timing
Let’s take the 5 years annualized returns as an example.
Earning every year 7.8% on your savings or just getting 0.1% is hell of a difference. It may does not look that much for one year.
But over 30 years, this is like getting $95,183 back for your $10,000 instead of just getting $10,304. This is 85 thousand dollars different. I do not have to tell you want you can do for that money.
To learn more about Trend Investing and long-term Market Timing:
- Sign up for our newsletter
- Check out the 100% money-back guarantee proposals we have now for you to try and learn about our Trend Investing Information service.
| Attachment | Size |
|---|---|
| 2010 SP500 Annualized Returns.gif | 11.05 KB |